
Boundary Lines
When studying rice yields variability for organic and conventional farms, Delmotte and al. collected data like soil clay content, date of sowing and rice stand at emergence, trying to explain rice grain yield.
A first way to extract information is to plot scatterplot, to view the cloud of data points.
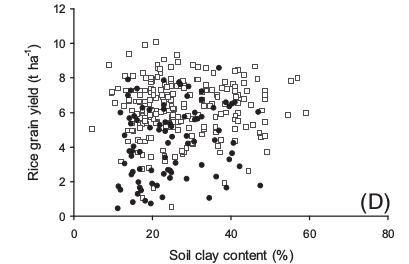
A traditional approach is then to fit a model to explain the data. This model is based on regression, and thus in some kind of averaging the data. However it has been shown difficult to separate the influence of a factor from the influence of other correlated factors. An approach to overcome this problem is instead of considering the whole set of data, only considering the maximum yields for a given predictor variable. In this approach, values below the maximum are said to be limited by other variables. It creates the concept of yield potential for a specific site, considering all the un-manageable yield-affecting factors.
The approach used in Delmotte2011 is described in Shatar 2004:
1- grouping of data points according to their predic- tor values, 2- removal of outliers, 3- identification of the ‘‘maximum-yield subset ’’ ; the data subset representing maximum yields at each predictor value and 4- fitting of a curve to the maximum-yield subset.
The curve fitted can be linear, polynomial, exponential … Here we use the same model as them (from Fermont et al. 2009):
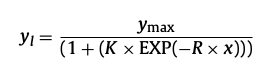
The following R code allows does the analysis: